Extra Questions for Class 7 Science Chapter 13 Motion And Time
Extra questions for Class 7 Science Chapter 13 Motion And Time with answers is given below. Our subject expert prepared these solutions as per the latest NCERT textbook. These questions will be helpful to revise the all topics and concepts. CBSE Class 7 extra questions are the most simple and conceptual questions that are prepared by subject experts for the students to study well for the final exams. By solving these extra questions, students can be very efficient in their exam preparations.
Motion And Time Class 7 Science Extra Questions and Answers
Very Short Extra Questions and Answer
1. What is the basic unit of time?
Answer: The basic unit of time is a second. Its symbol is s.
2. What is the basic unit of speed?
Answer: Basic unit of speed is metre per second (m/s).
3. What is speedometer?
Answer: Speedometer is an instrument that indicates the speed of a vehicle.
4. What is distance-time graph?
Answer: Distance-time graph represents the speed of an object.
5. What is speed?
Answer: The distance moved by an object in a unit time is called its speed.
6. What is oscillatory motion?
Answer: The to and fro motion of an object is called oscillatory motion.
7. What is motion?
Answer: Motion is a change in position of an object over time.
8. What is circular motion?
Answer: Circular motion is rotation of an object along a circular path.
Short Extra Questions and Answers
1. Give an example of oscillatory motion.
Answer: The to and fro motion of a simple pendulum is an example of a periodic or an oscillatory motion.
2. What is non-uniform motion?
Answer: If the speed of an object moving along a straight line keeps changing, its motion is said to be non-uniform.
3. What is uniform motion?
Answer: An object moving along a straight line with a constant speed is said to be in uniform motion.
4. What is the smallest time interval that can be measured with commonly available clocks and watches?
Answer: The smallest time interval that can be measured with commonly available clocks and watches is one second.
5. What is a simple pendulum?
Answer: A simple pendulum consists of a small metallic ball or a piece of stone suspended from a rigid stand by a thread. The metallic ball is called the bob of the pendulum.
6. How time was measured when pendulum clocks were not available?
Answer: Many time measuring devices were used in different parts of the world before the pendulum clocks became popular. Sundials, water clocks and sand clocks are some examples of such devices.
7. What are quartz clocks?
Answer: Nowadays most clocks or watches have an electric circuit with one or more cells. These clocks are called quartz clocks. The time measured by quartz clocks is much more accurate than that by the clocks available earlier.
8. What is average speed?
Answer: Speed or average speed is the total distance covered divided by the total time taken. Thus,

9. The distance between two stations is 240 km. A train takes 4 hours to cover this distance. Calculate the speed of the train.
Answer: Distance between two stations = 240 km
Time taken to cover this distance = 4 hours
Speed = Distance/Time taken
= 240/4
= 60 km/h
10. A simple pendulum takes 32 s to complete 20 oscillations. What is the time period of the pendulum?
Answer: Number of oscillations = 20
Total time taken to complete 20 oscillations = 32 s
Time period = Total time taken / Number of oscillations
= 32/20
= 1.6 s
11. Salma takes 15 minutes from her house to reach her school on a bicycle. If the bicycle has a speed of 2 m/s, calculate the distance between her house and the school.
Answer: Time taken = 15 min = 15 × 60 = 900 seconds
Speed = 2 m/s
Distance = Speed × Time
= 2 × 900
= 1800 m
= 1800/1000
= 1.8 km
12. When pendulum is said to have one complete oscillation?
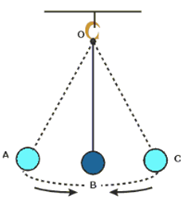
Answer: The pendulum is said to have completed one oscillation when its bob, starting from its mean position B, moves to A, to C and back to B.
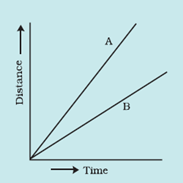
13. The following Fig. shows the distance-time graph for the motion of two vehicles A and B. Which one of them is moving faster?
Answer: Vehicle A is moving faster. Speed of the vehicle is greater if it covers maximum distance in a given interval of time.
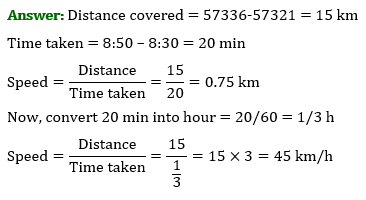
14. The odometer of a car reads 57321.0 km when the clock shows the time 08:30 AM. What is the distance moved by the car, if at 08:50 AM, the odometer reading has changed to 57336.0 km? Calculate the speed of the car in km/min during this time. Express the speed in km/h also.
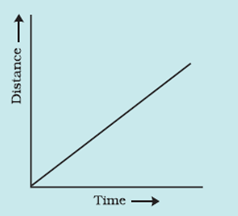
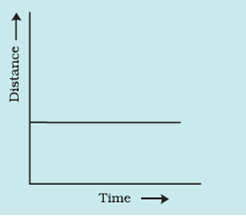
15. Show the shape of the distance-time graph for the motion in the following cases:
(i) A car moving with a constant speed.
(ii) A car parked on a side road.
Answer: (i) A car moving with a constant speed.
(ii) A car parked on a side road.
Long Extra Questions and Answers
1. Explain how in ancient time a day, a month and a year were measured?
Answer: Our ancestors noticed that many events in nature repeat themselves after definite intervals of time. For example, they found that the sun rises every day in the morning. The time between one sunrise and the next was called a day. Similarly, a month was measured from one new moon to the next. A year was fixed as the time taken by the earth to complete one revolution of the sun.
2. What are the points that should be considered while choosing the most suitable scale for drawing a graph?
Answer: Some of the points to be kept in mind while choosing the most suitable scale for drawing a graph are:
- the difference between the highest and the lowest values of each quantity.
- the intermediate values of each quantity, so that with the scale chosen it is convenient to mark the values on the graph, and
- to utilise the maximum part of the paper on which the graph is to be drawn.
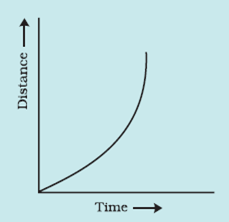
3. Which of the following distance-time graphs shows a truck moving with speed which is not constant?
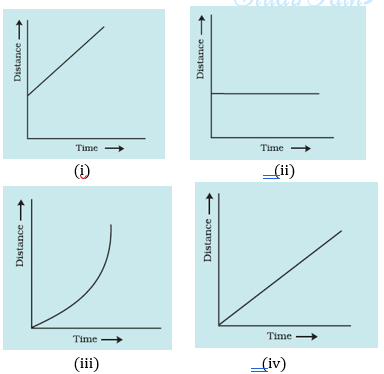
Answer: (iii)
4. Write down the steps to draw a graph.
Answer:
- Draw two perpendicular lines to represent the two axes and mark them as OX and OY.
- Decide the quantity to be shown along the x-axis and that to be shown along the y-axis.
- Choose a scale to represent the distance and another to represent the time on the graph.
- Mark values for the time and the distance on the respective axes according to the scale you have chosen.
- Mark the points on the graph paper to represent each set of values for distance and time. Join the points.